Objective
The Covid-19 pandemic has laid bare the other pandemic, that of socio-territorial inequalities. In this project, we will see how living conditions are correlated with potential virus transmission clusters.
Are the places of Covid-19 contamination the places where the crowding of inhabitants also takes place?
The objective here is to contribute to a cartographic understanding of the distribution of Covid cases in the city.
Approach
At first glance, what seems logical is that the more people there are, the more widespread the virus is. Also, we could believe that where there is more concentration of people, these are low-income areas, or at least poor neighborhoods.
More concretely, I am going to formulate the hypothesis that the areas where people are overcrowded in overcrowded housing areas are also the areas where people take public transport to go to work, which represents a “stacking” of factors that worsen the health situation in the face of Covid-19.
To do this, we will first see the types of population that are potentially most likely to transmit the virus because of their daily activities and then the housing condition according to the socio-economic profile.
Data
Since there has not been an update of the INSEE database on the districts of Marseille since 2012, and for this project to make sense, I will work under the assumption that the local population does not hasn’t changed drastically since 2012.
Process
I will study all the types of population that are a priori the most likely to accelerate the circulation of the virus in view of their daily activities.
Thus, the population aged between 0 and 14 would transmit the virus more because they have to travel every day to go to school. And the one aged between 15 and 29 would do so because of her “recklessness” vis-à-vis the measures imposed by the government.
As for the labor force, workers, craftsmen and traders are those who have to go to work every day because of their impossibility of teleworking.
Finally, there is the immigrant population which presents a higher risk of contamination because of its socio-economic situation.
To get a better idea of the situation in the city, I will map two variables: the number of employed workers aged 15 or over who mainly use public transport to go to work (Figure 1) and the population at higher risk transmit the virus (Figure 2).
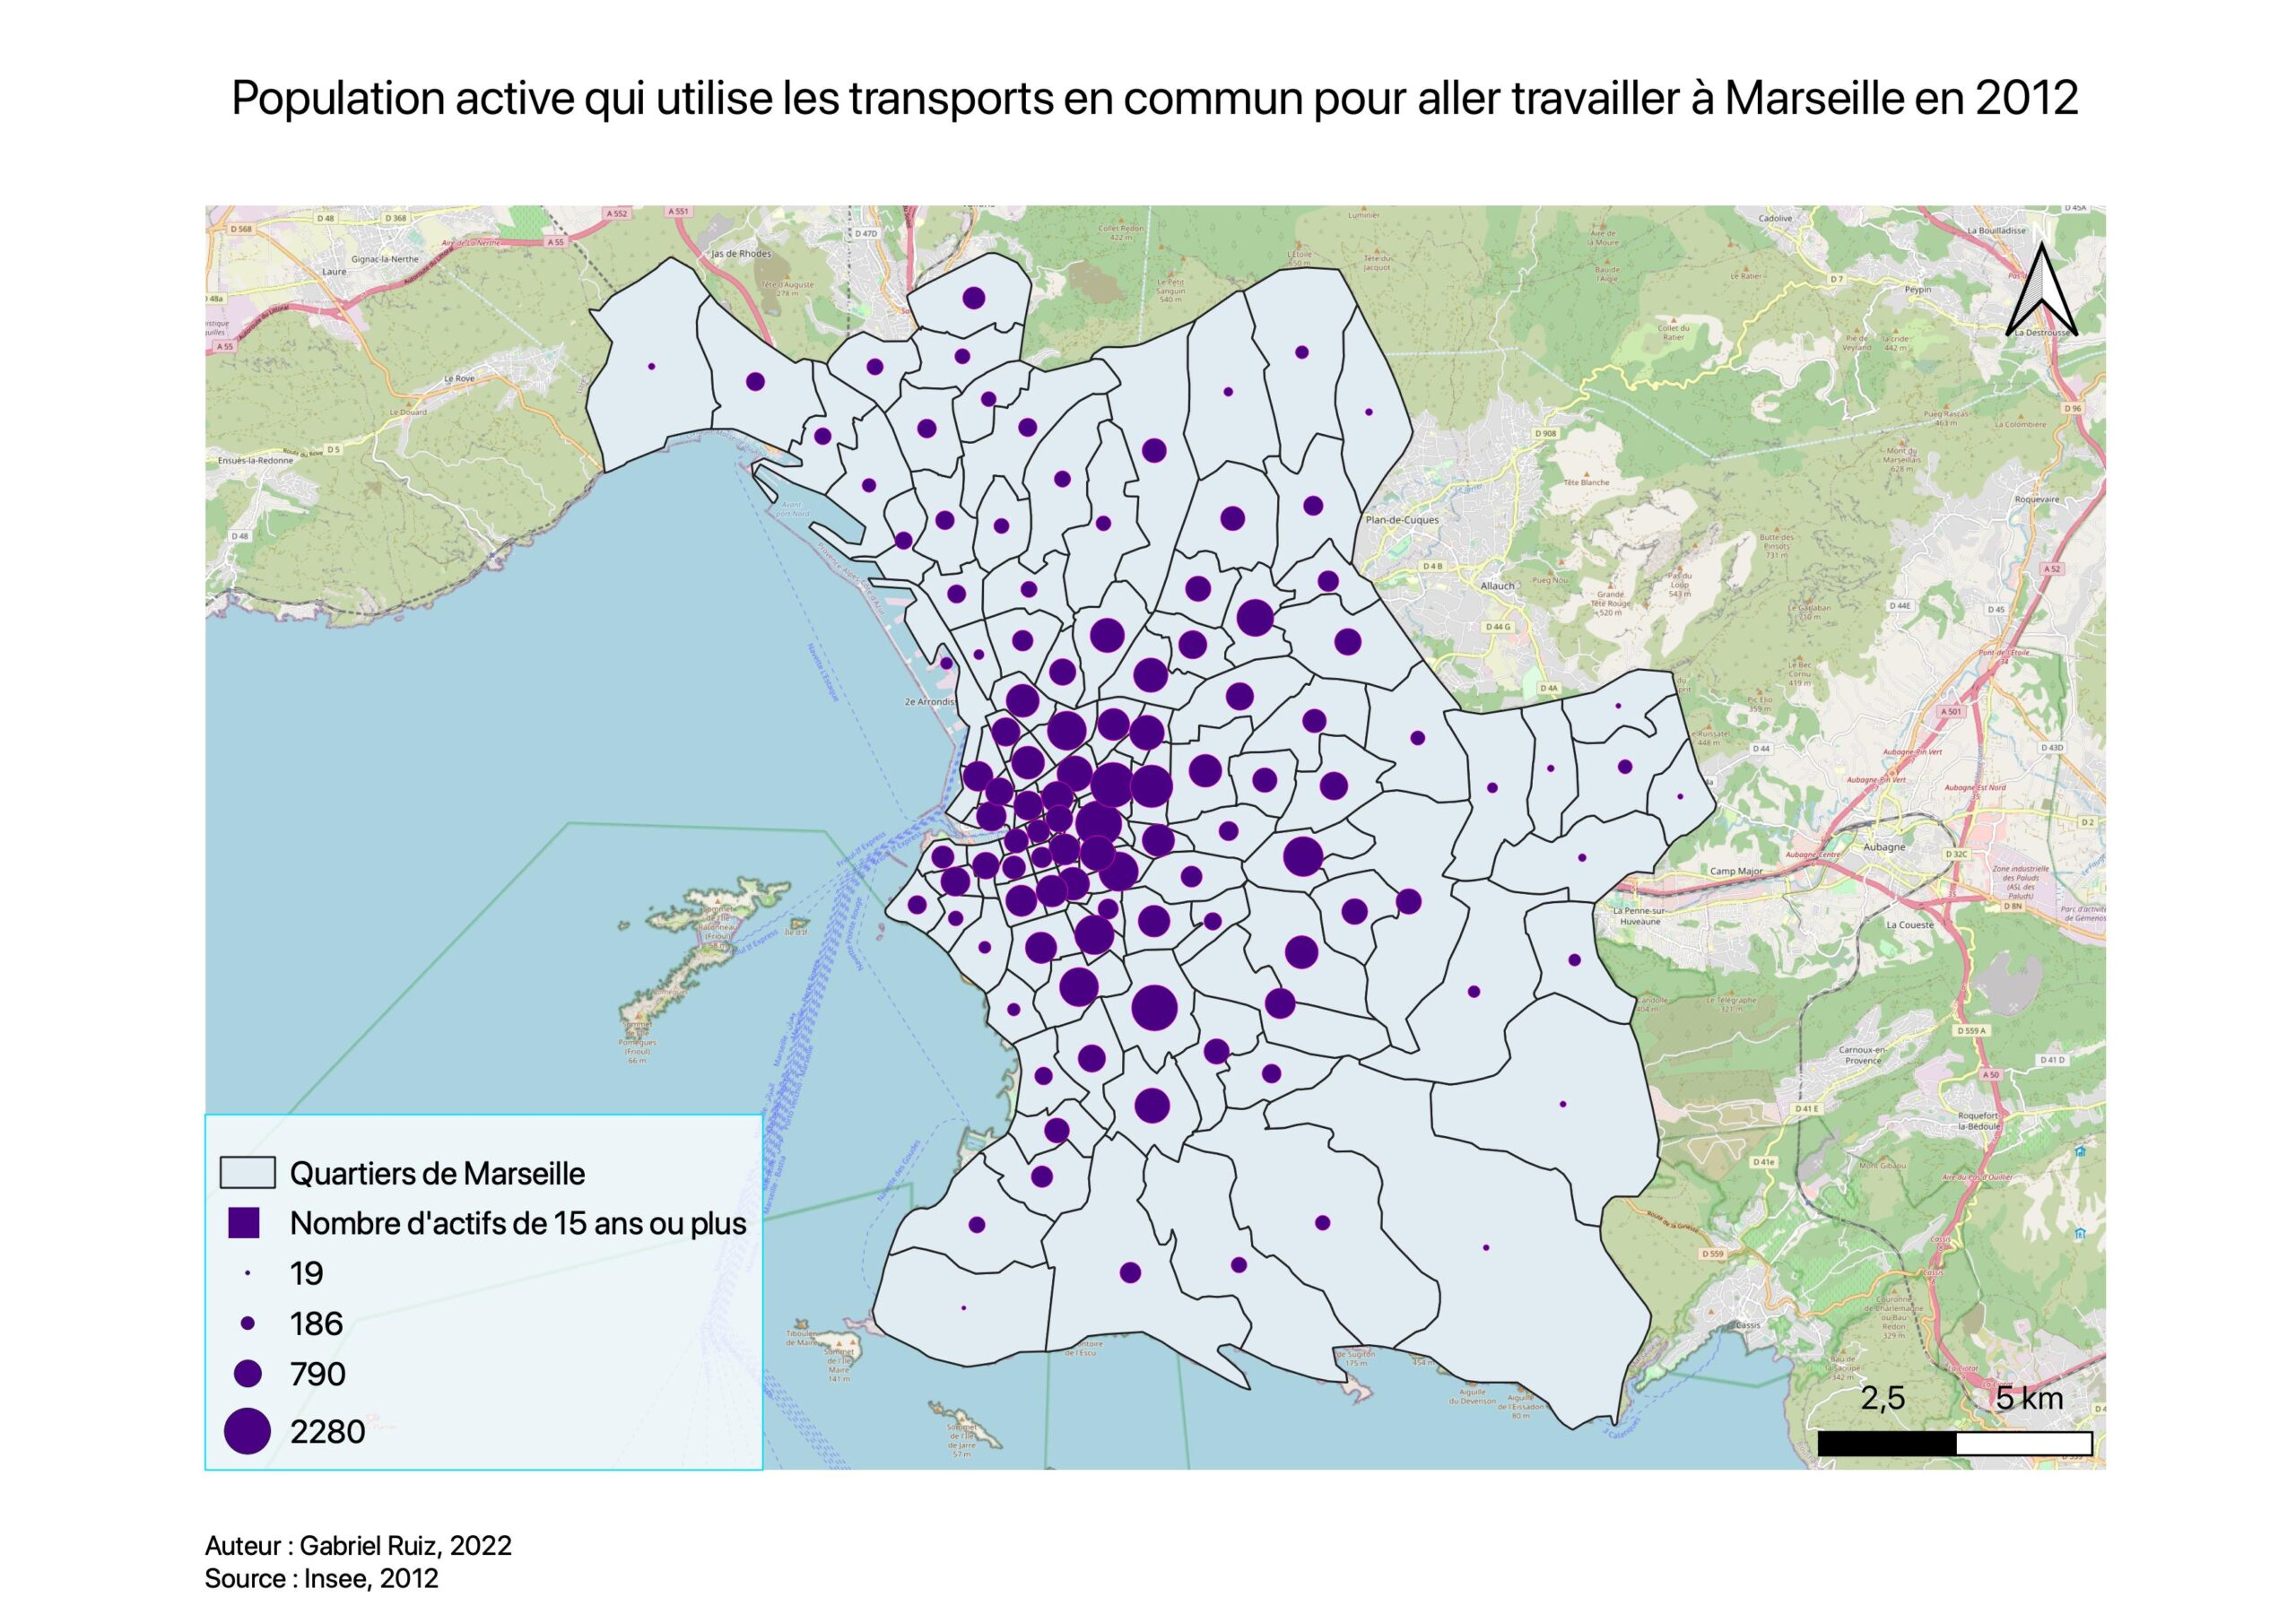 Figure 1. Map of the population aged 15 or over who mainly use public transport to go to work in Marseille in 2012.
There is a distribution of the strongest increasing values in the city center of Marseille and in the urban part which is located in the south of the city, between the city center and the Calanques national park.
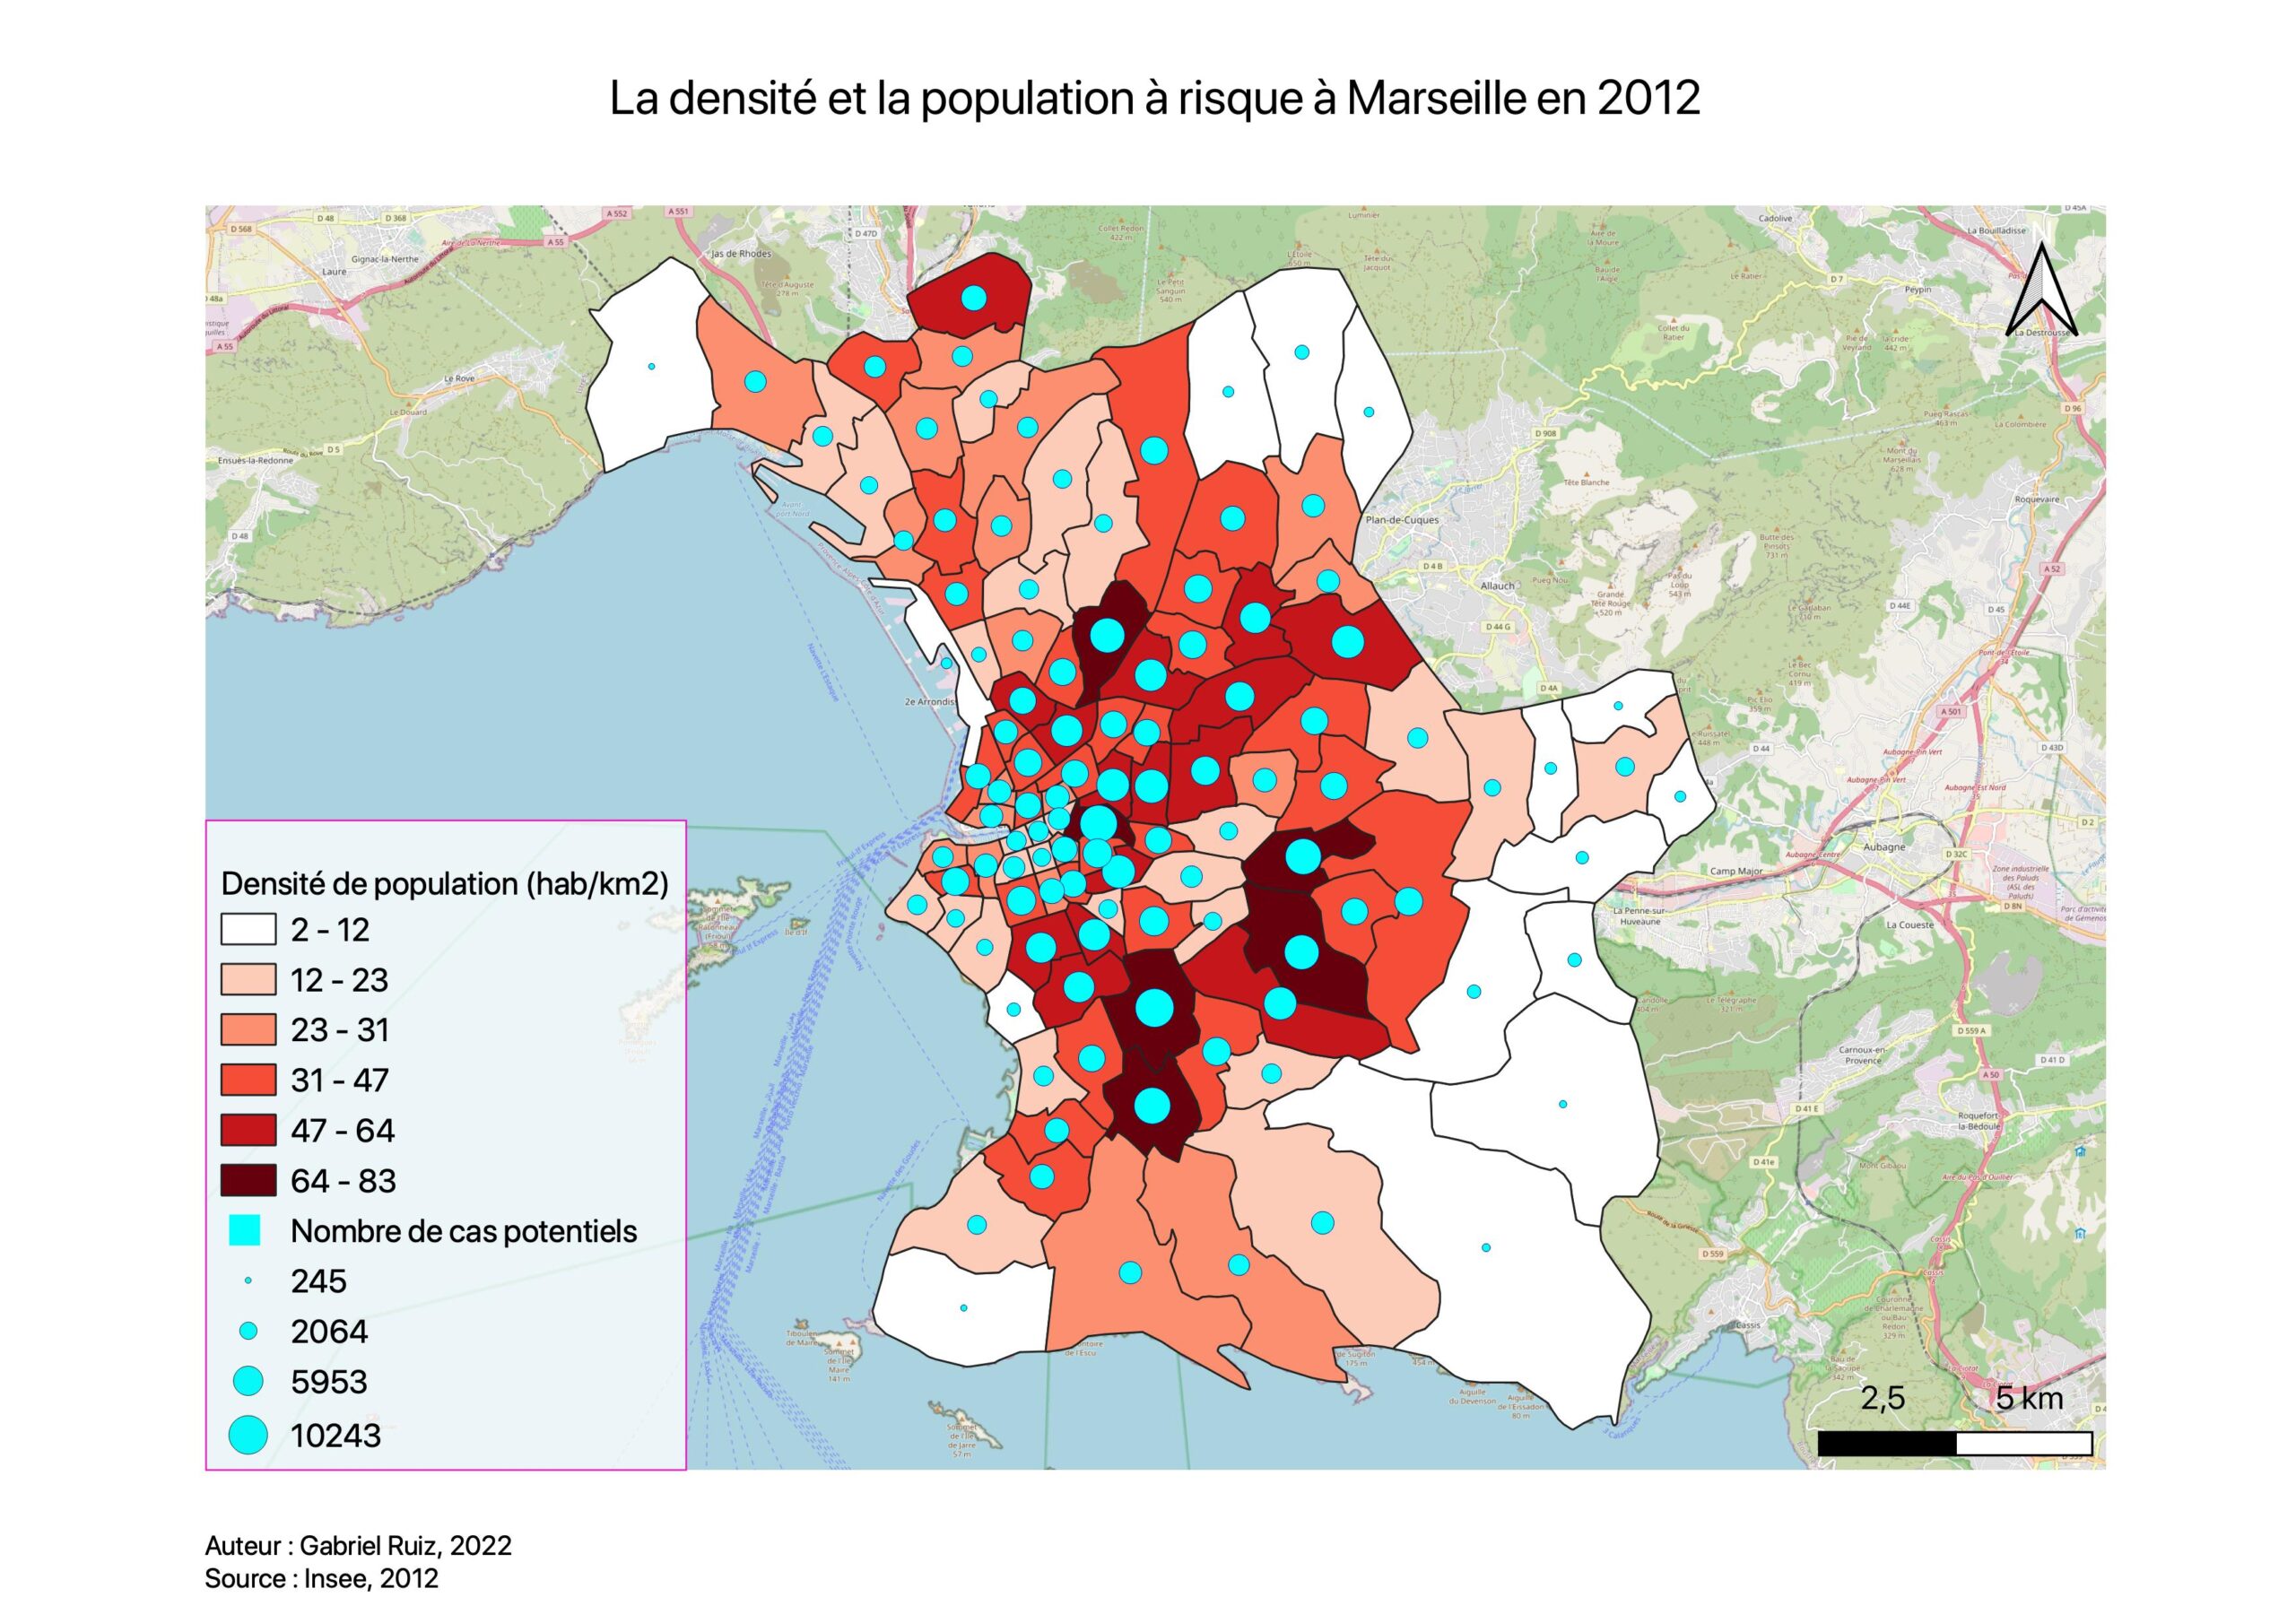 Figure 2. Map of population density and population considered at risk in Marseille in 2012.
We observe that the neighborhoods located in the city center as well as the neighborhoods located to the south (just before the Parc des Calanques) are generally those with the most people “at risk” and the highest population density.
Note: the population is here defined as the matrix addition of the population types that I previously considered to be “at risk”.
The average number of people in main residences
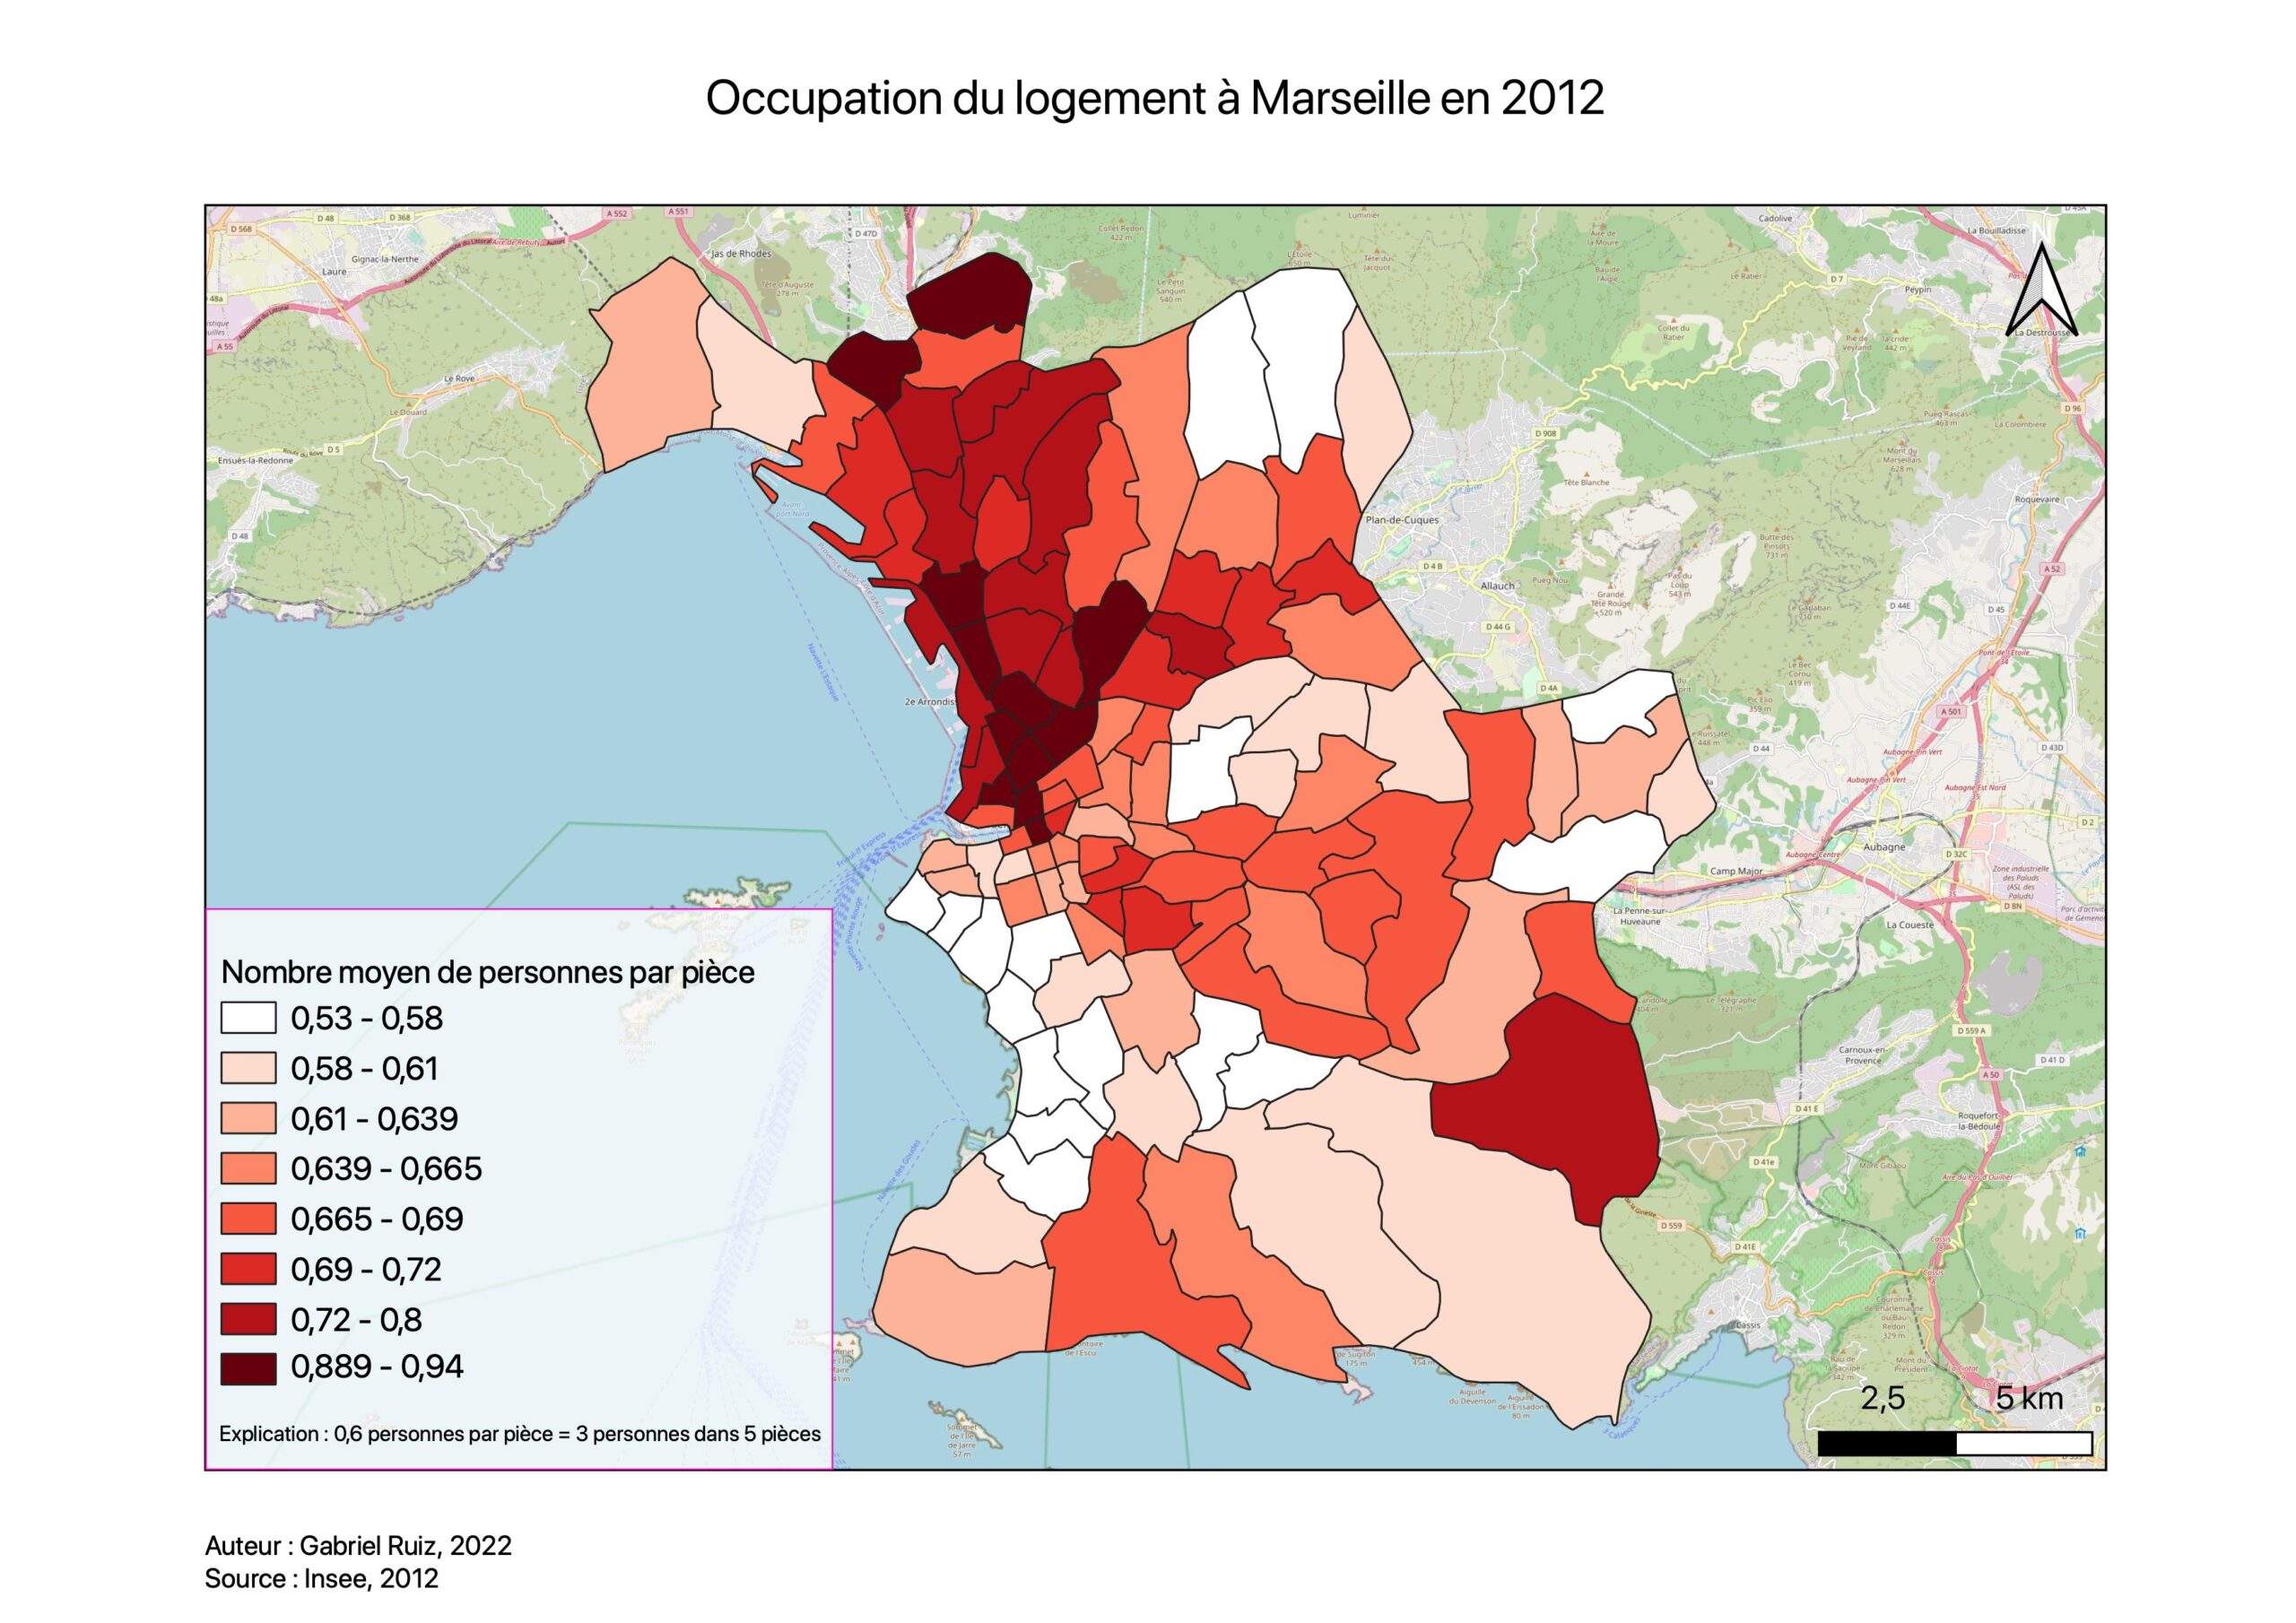 Figure 3. Map of housing occupancy in Marseille in 2012.
The statistics mapped here come from a cross between the number of people in main residences and the number of rooms in main residences.
We observe that the districts located in the city center as well as the districts located to the north are generally those which are the most overcrowded, which is not surprising knowing that the North concentrates most of the social residences of the city. While the districts located to the south are the least overcrowded which is, once again, not surprising given the level of income of households in the south.
This map was made to highlight overcrowding in housing as density alone doesn’t tell us much
Total number of people infected
From March to April 2021, there was an upsurge in the epidemic due to the spread of the alpha and beta variants, then known respectively as the English variant and the South African variant. We will then see the impact of these variants in the city of Marseille (Figure 4):
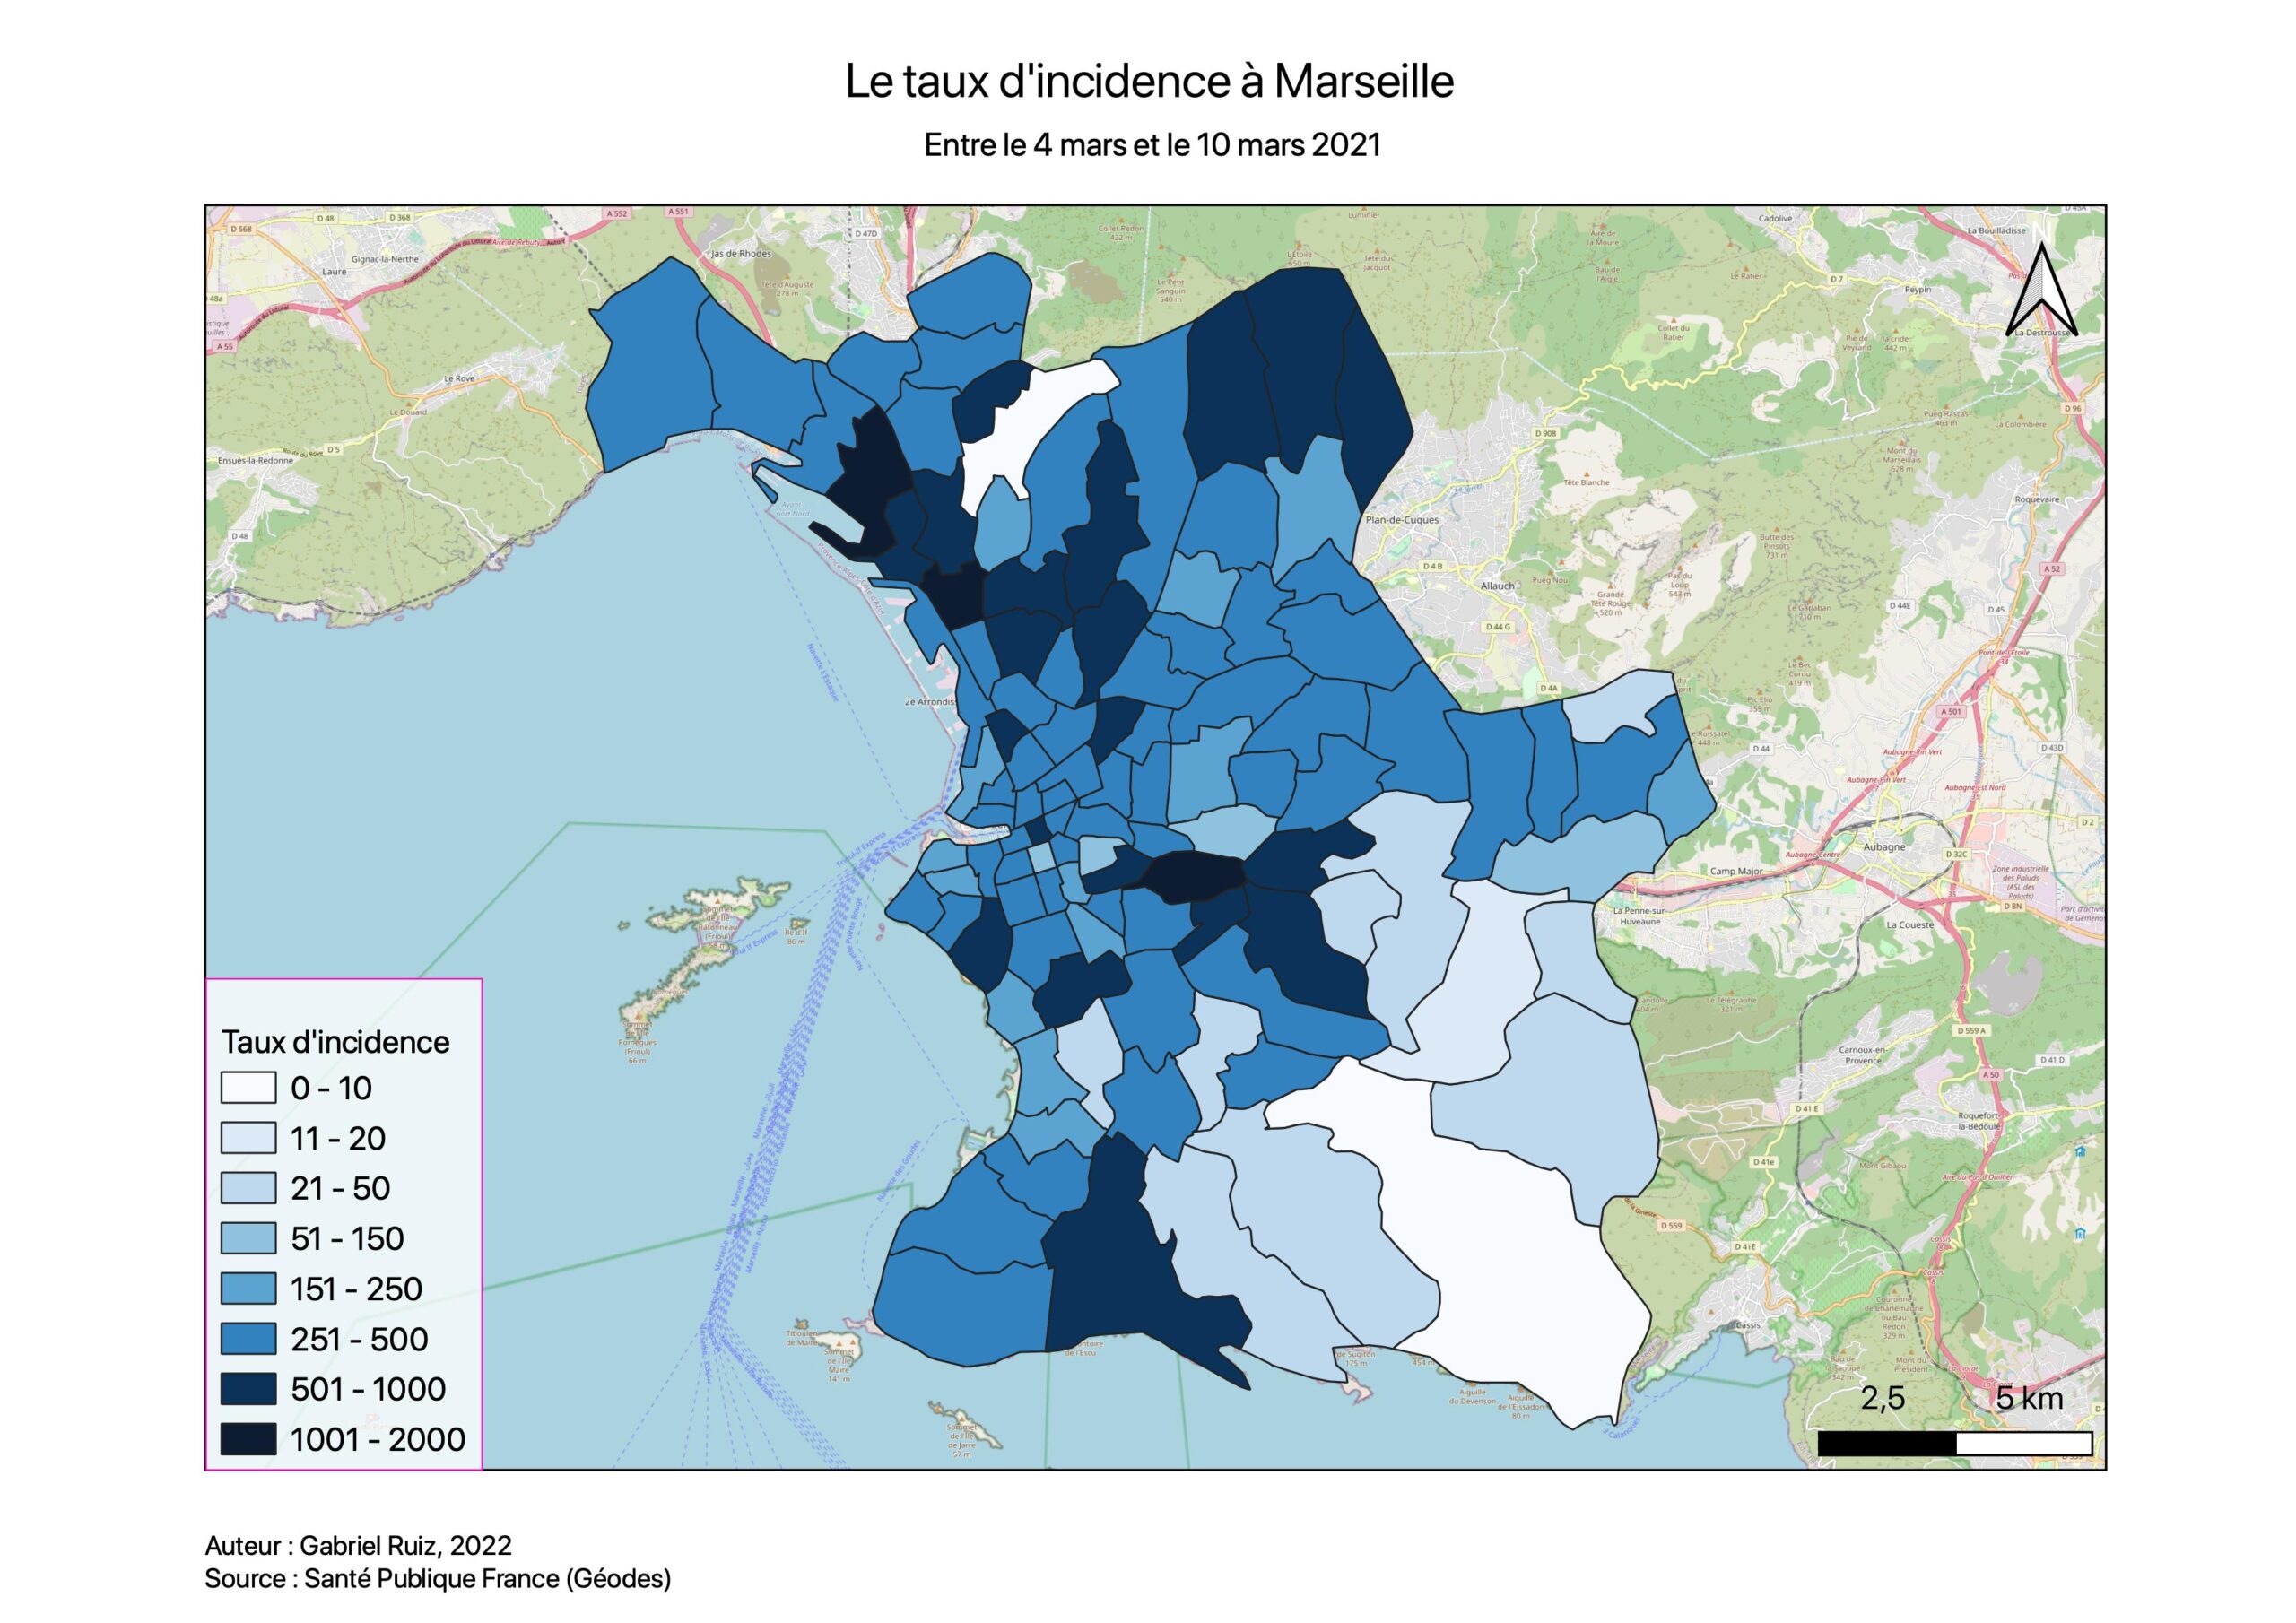 Figure 4. Map of the incidence rate in Marseille between March 4 and March 10 in 2021.
The incidence rate corresponds to the number of positive tests per 100,000 inhabitants. The alert threshold is 50 cases.
We see that the highest incidence rates are mainly in the north of the city, to a lesser extent in the city center and in the Sormiou district in the south of Marseille.
Results
Cartographically, we can see that there is a correlation between the overcrowding of housing and the number of people infected.
In the future I will do a causality study of this statistical correlation.
