Project
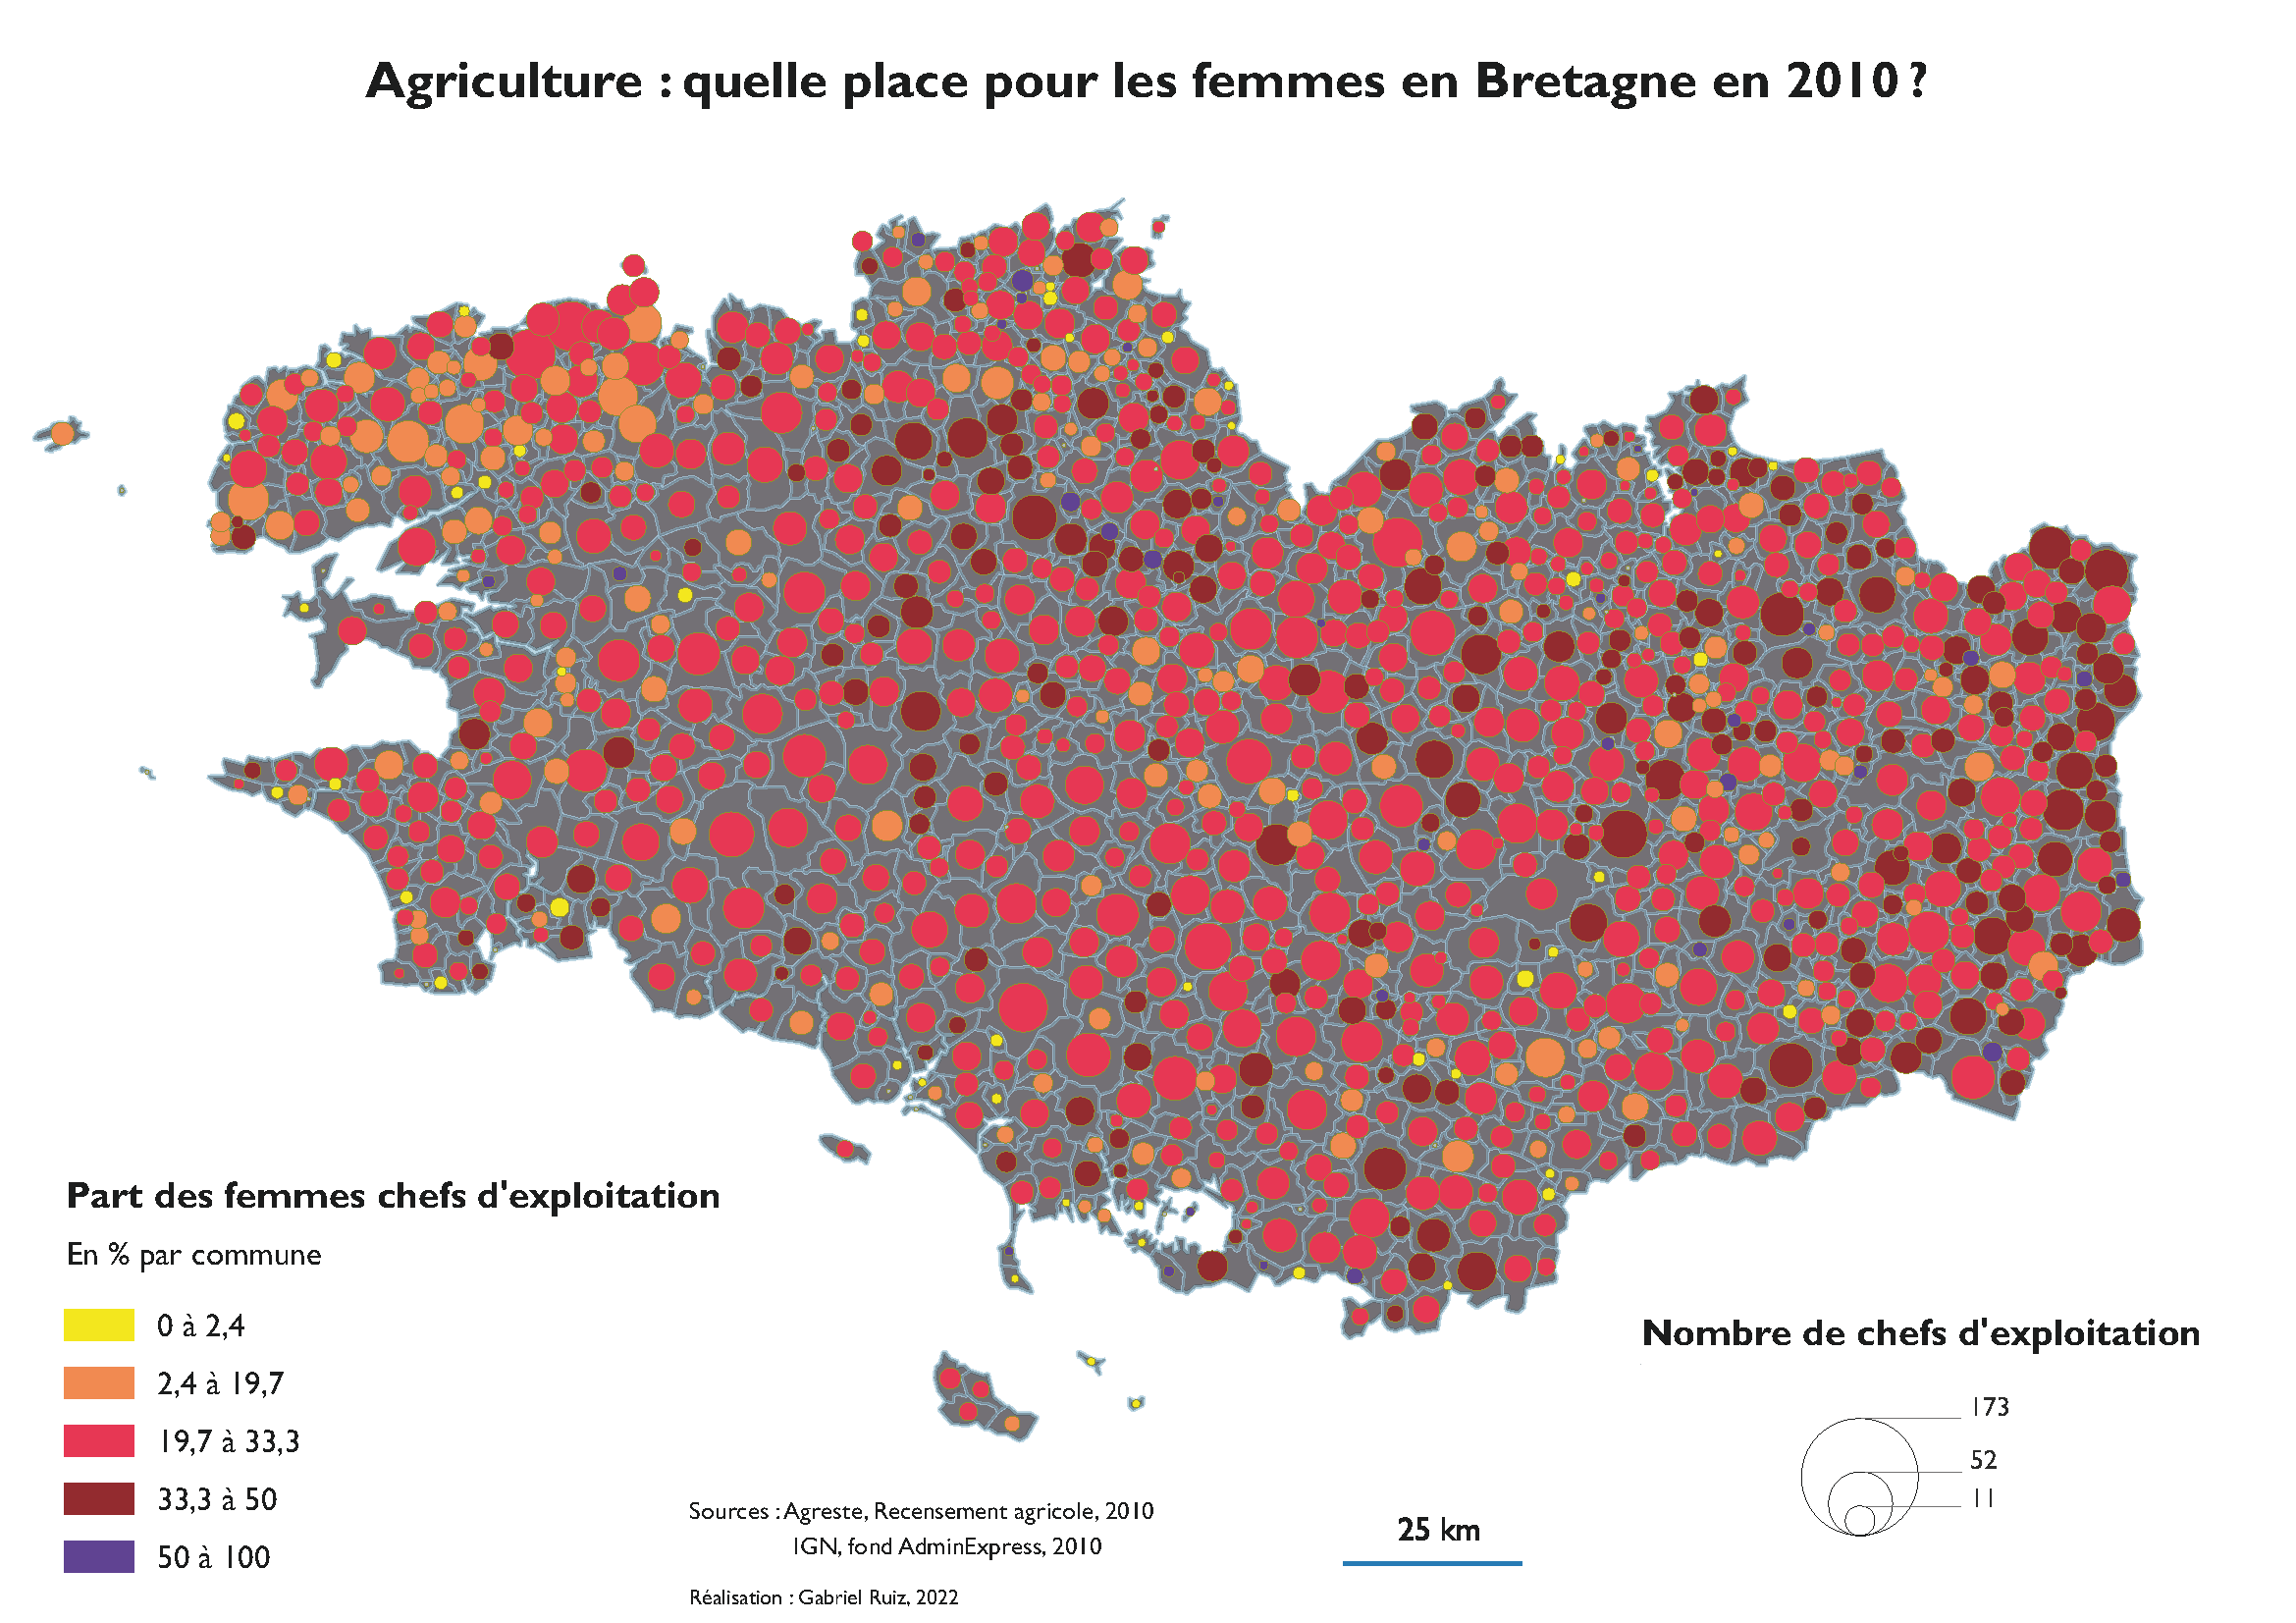
Firstly, I will produce a thematic map of the 2010/2020 agricultural census crossing two complementary statistical indicators by combining two thematic analyzes (symbols and choropleth).
Source: https://stats.agriculture.gouv.fr/cartostat/
This map must be clear, readable, and objective in the way it represents the information.
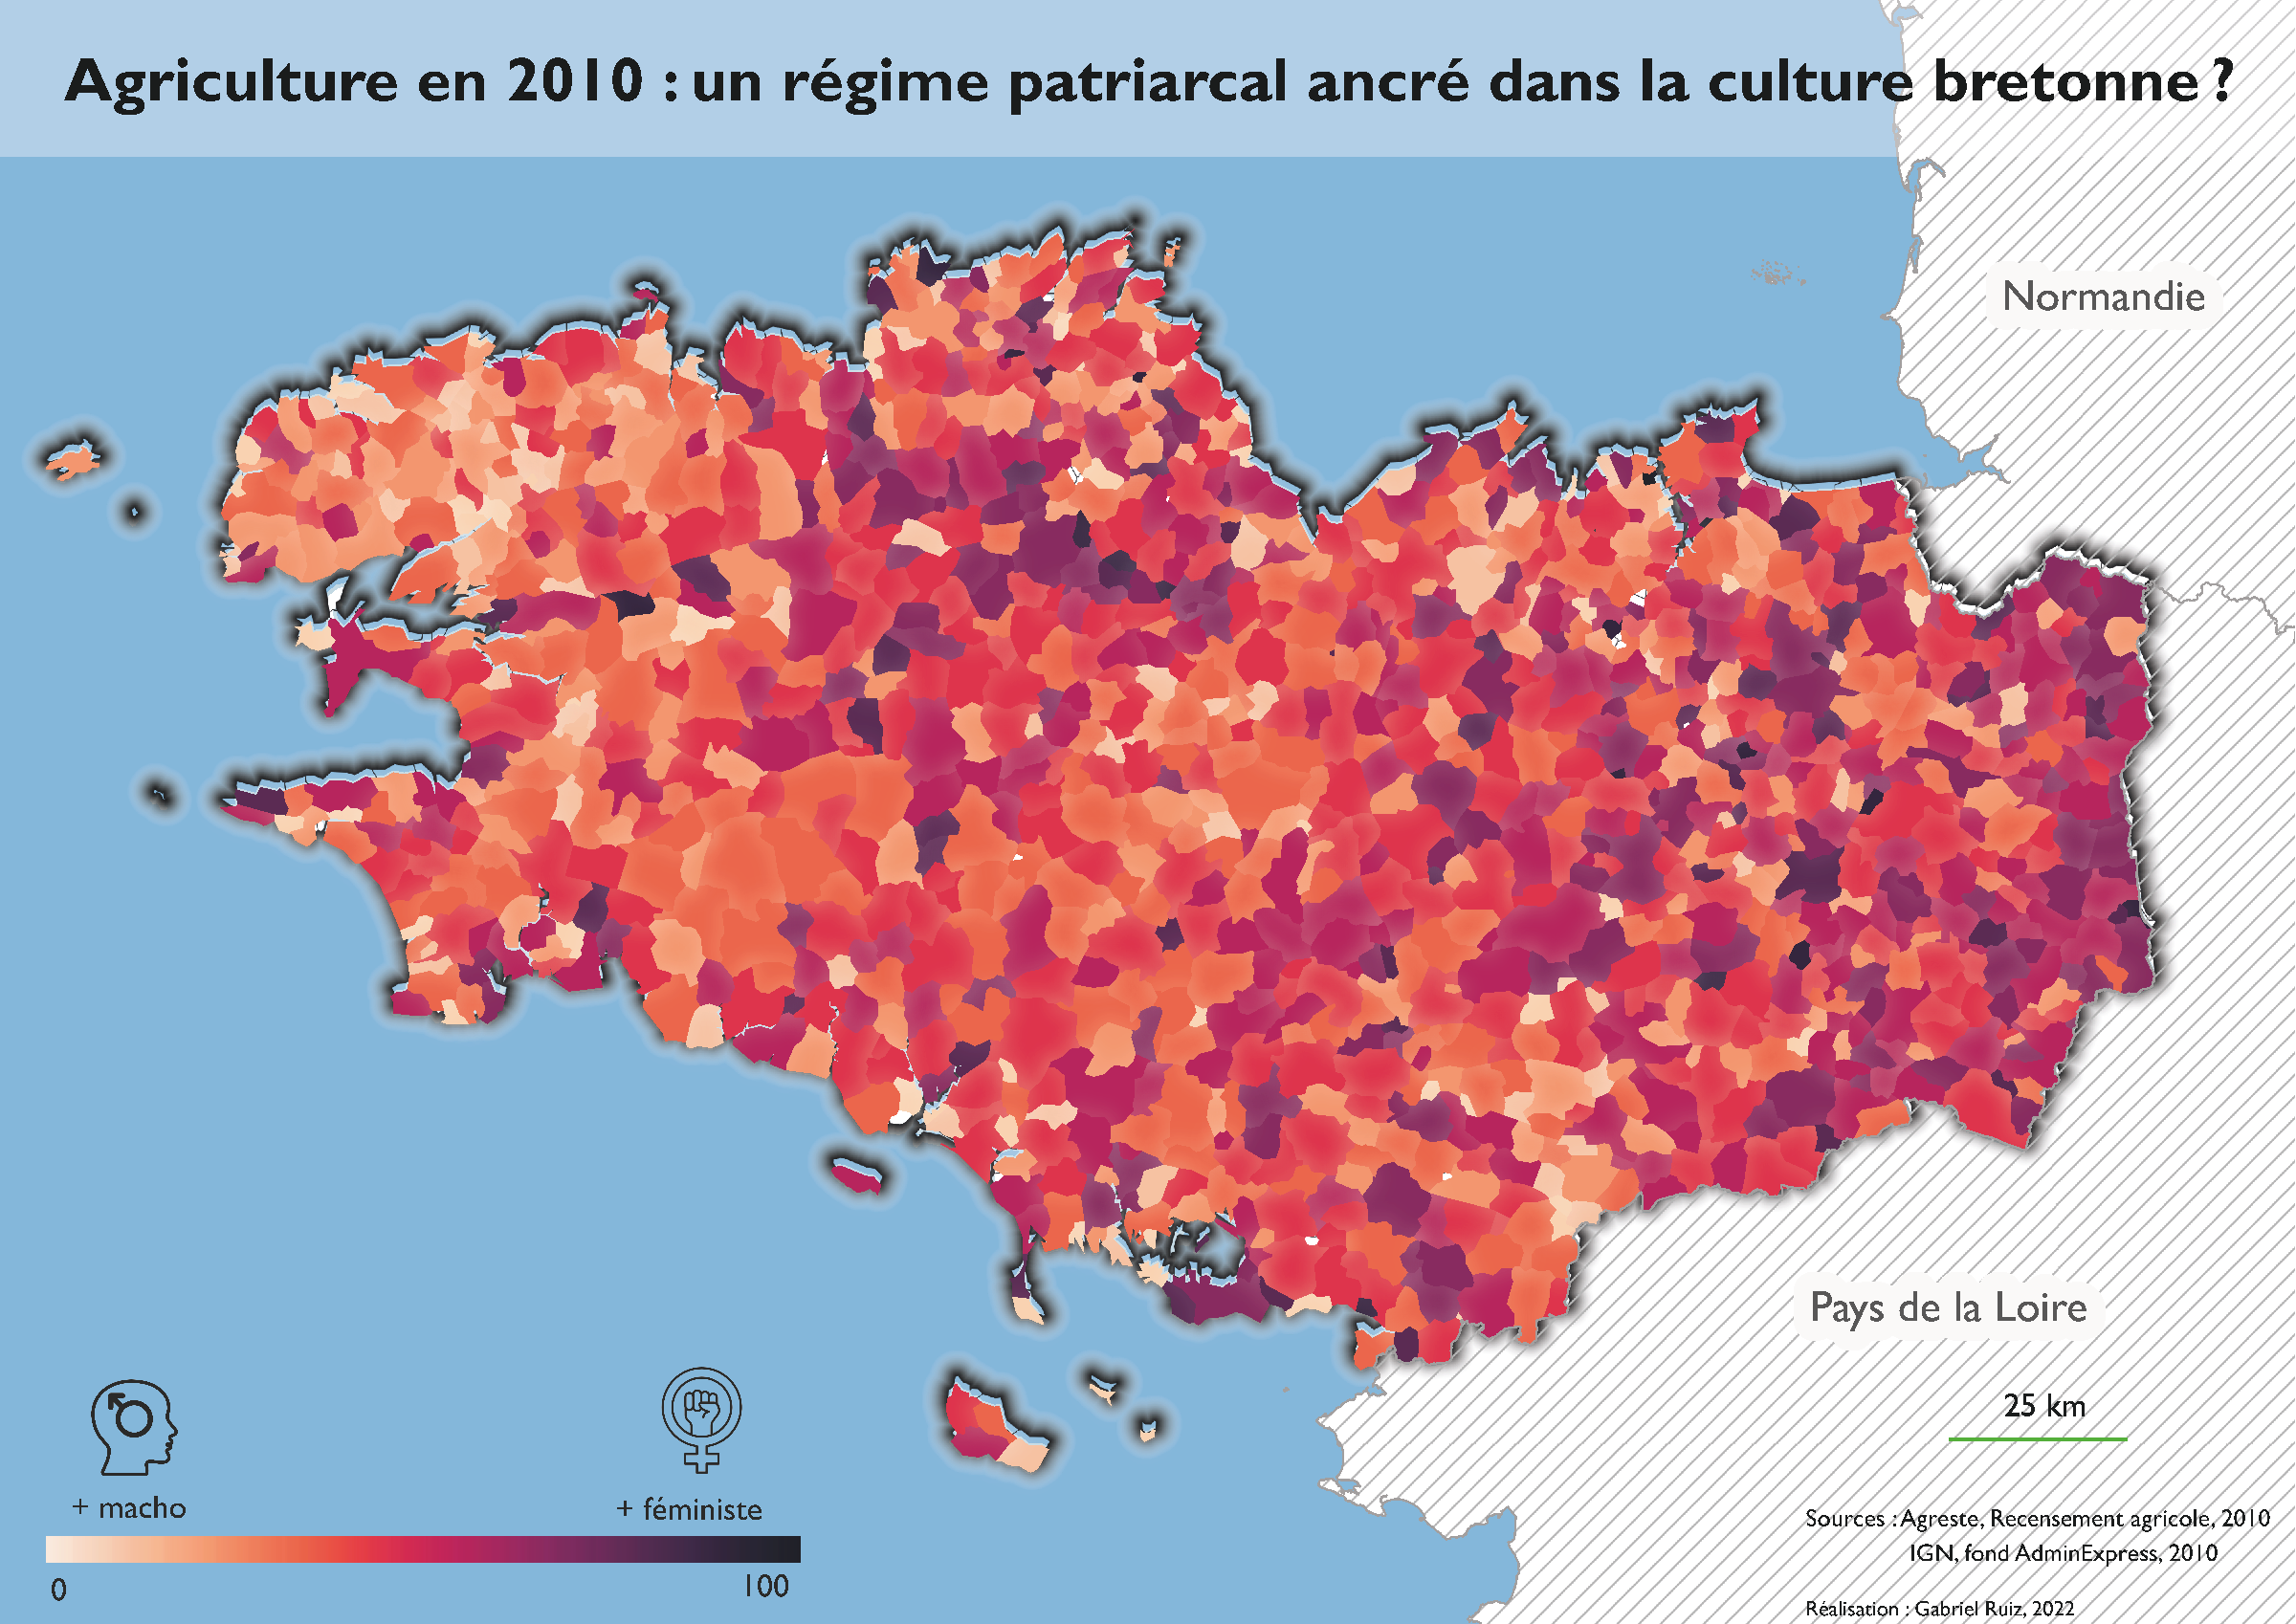
Secondly, I will take the role of a journalist and will try to sell as many newspapers as possible. So I will interpret the dataset and then transform the previous map based on elements of graphic design in order to convey a (controversial) message.
Results
Objective map

Figure 1. Agriculture: what place for Women in Brittany in 2010?
Controversial map

Figure 2. Agriculture in 2010: a patriarchal regime rooted in Breton culture?